Written By J. E. Williams, OMD, FAAIM
Get tested annually to prevent disease. To improve your health and live longer, aim for optimal levels of key blood tests. Do you know your optimal levels?
You just received your blood test results from a comprehensive metabolic panel. Do you need a doctor to interpret them for you? Can you understand the results on your own? I believe that you can do learn to evaluate your own risks for health and disease prevention.
Here’s a sample test.
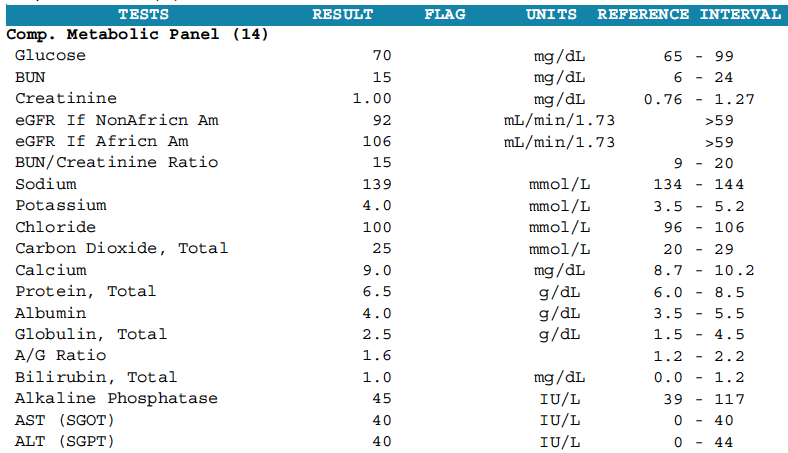
Each lab has its own look but contains standard information including the test name, results, a “flag” for abnormal results, the units of measurement for each test, and the reference interval. The standard reference range of a lab test gives the values that fit 95% of healthy people in a population. Medical laboratory tests provide an upper and lower limit.
Doctors consider you healthy if your results fall within the reference range. Some ranges vary by gender and age. Each laboratory validates its own reference ranges. Variations of intervals may occur for the same test from different labs. That’s why it’s essential to use the same lab when testing over time.
Just because your results fall within the reference range, doesn’t mean you’re healthy. And, being within the reference range is not good enough for optimal health. To achieve the best results in prolonging your health, aim for optimal levels.
Beyond Standard Reference Ranges
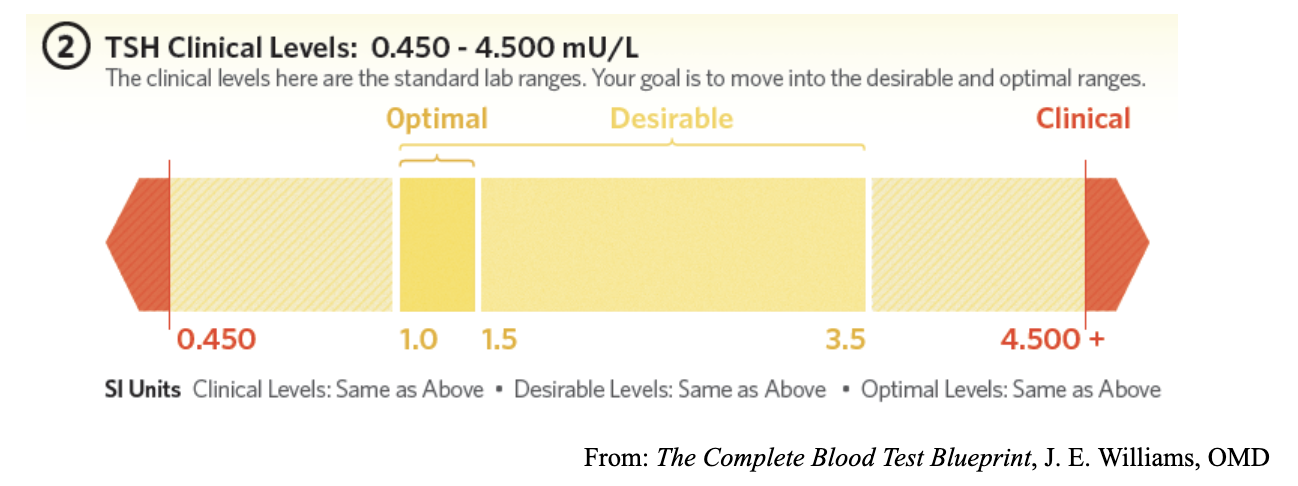
In The Complete Blood Test Blueprint, I defined two zones within the standard laboratory reference ranges associated more with health than with disease: (1) desirable, and (2) optimal.
The desirable range is a favorable level within the laboratory reference range where you’re least likely to develop a disease. I define an optimal range as the levels found by clinical experience and epidemiological studies to result in the lowest disease risk and the most significant health benefit. For the best chance of achieving longevity, aim for the optimal range on test results.
Example 1: Thyroid Stimulating Hormone
Thyroid stimulating hormone (TSH) is a pituitary hormone tested by your doctor to determine if your thyroid gland is functioning correctly. Too much TSH means the pituitary is trying to get a sluggish thyroid gland to work better. Too little means there is enough thyroxin (T4) circulating in your blood, so TSH remains low until more T4 is needed.
If your TSH is above the reference range, you have a condition called hypothyroidism, an under-functioning thyroid gland. If it’s below the reference range, you may have an overactive thyroid gland or hyperthyroidism. But, the standard laboratory reference range for TSH may not be right for you.
Clinical chemists and doctors decided decades ago that healthy people with normal functioning thyroid glands have TSH levels within a range of 0.450 to 4.500 mIU/L, and some labs go as high as 5.000mIU/L. In clinical shorthand, the diagnostic range is rounded out to 0.4-4.0.
When diagnosing underactive thyroid function, most physicians consider TSH levels above 10 mIU/L as thyroid failure. Levels between 5–10 mIU/L are thought of as mild hypothyroidism. This means that if your TSH is between 3.5-4.5, your conventional doctor won’t diagnose hypothyroidism and therefore won’t treat you even if you have symptoms of a sluggish thyroid.
However, in recent years clinical scientists and physicians practicing integrative medicine found that the standard range is too broad for everyone. Many people have symptoms of low thyroid function even when their TSH is well below the upper level of the standard reference range of 0.4-4.0. The American Association of Clinical Endocrinologists established a normal range of 0.3-3.0. And, the National Academy of Clinical Biochemistry recommended range is 0.5-2.0.
Symptoms of Low Thyroid Function:
What’s The Best TSH Level For Your Body?
When you get your test results, make sure that you’re TSH level is within the standard laboratory ranges. If your level is too high, or too low, discuss treatment options with your doctor. Then, see if you’re within desirable limits. Some need to hit the optimal zone to feel well.
If your TSH level falls between 3.5-4.5, and you have many of the symptoms of hypothyroidism, find an integrative medicine practitioner who will help you achieve a level within the desirable range. Remember, individual variations matter. For some people, their optimal TSH may have to be in a very tight range of 1.0-1.5.
Thyroid disease is common. The thyroid gland gets tired with age, exposure to infection, stress, and toxic chemicals in the air, as well as in the water supply and food chain. Remember, hypothyroidism is a very treatable condition. There is no reason to go untreated or to get inadequate treatment
Risk Stratification And The Multimarker Approach
Another method of lab test results evaluation is risk stratification. Like the desirable and optimal range concept, risk stratification goes beyond standard laboratory reference values by identifying high, moderate, and low risk for a disease.
Risk stratification can predict severe diseases like heart failure before they happen. Optimal levels of a biomarker indicate low or no risk. Borderline values indicate moderate or average risk. High levels indicate an increased risk.
For life-threatening conditions, like cardiovascular disease, clusters of factors multiply your risk for a heart attack or stroke. Even if your total cholesterol results are within the normal reference range, additional elements are used to determine your disease risk.
Example 2: C-Reactive Protein, High-Sensitivity (CRP-hs)
ClevelandHeartLab (CHL) is a specialty cardiovascular lab owned by Quest Diagnostics that pioneered a multimarker approach for cardiovascular disease evaluation. The CHL panel combines related tests like low-density lipoprotein (LDL) cholesterol with inflammation markers like high sensitive C-reactive protein (CRP-hs).
The JUPITER Trial published (Ridker, 2009) was designed to provide justification for the use of statin drugs. As researchers analyzed the study’s results, they also found that multiple factors add up. For example, patients with low LDL and high CRP-hs had twice the risk of a heart attack as those with low LDL and low CRP-hs.
If you look only at your LDL cholesterol, you assume that you are at low risk if it’s in the normal range. But when CRP-hs is high, your risk is magnified. If an additional marker of inflammation like myeloperoxidase (MPO) is elevated and your CRP-hs is high, your risk for a cardiovascular event is four times greater. CHL factors these markers into their report of results to aid in understanding your CVD risk.
What Is CRP?
C-Reactive Protein (CRP) is a type of protein secreted from the liver that increases in response to inflammation. It is particularly sensitive to inflammation in the walls of coronary arteries. CRP is a lab marker for evaluating inflammation in the body.
CRP is present in the acute phase of infection or inflammation, as well as during chronic inflammation. High levels are diagnostic tip-offs that you may have coronary artery disease, diabetes, or cancer. People with very high CRP are more prone to develop stroke, heart attack, or peripheral vascular disease. CRP is also elevated in cases of colitis and Crohn’s disease. People with autoimmune conditions like rheumatoid arthritis can also have high CRP.
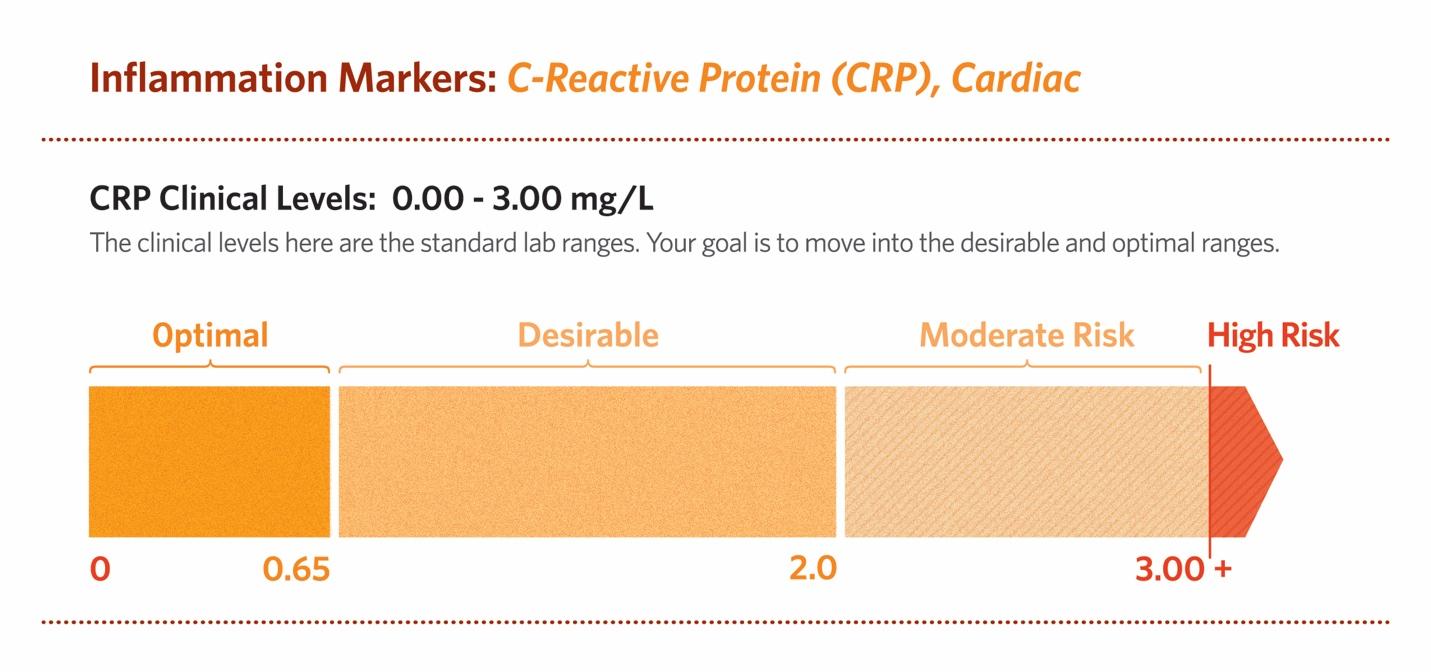
CRP highly sensitive (hs-CRP), also termed CRP cardiac, predicts high-risk patients with cardiovascular and peripheral vascular disease. Inflammation plays a fundamental role in all phases of atherosclerosis. CRP actively participates in atherogenesis. (Salazar et al., 2014)The standard range for hs-CRP is 0.00 – 3.00 mg/L.
Getting tested for CRP-hs is as necessary to disease prevention as flossing your teeth or getting your LDL cholesterol level checked. Knowing if your CRP-hs level is high and how to lower it could save your life.
5 Reasons to Test Your hs-CRP:
Your hs-CRP results provide a scale of relative risk. Less than 1.00 is the best. Over 3.00 is considered very high risk. A level over 10.00 may indicate infection or acute inflammation. It is also a marker for an unusually high risk for cardiovascular disease.
Cardiovascular and metabolic risk factors tend to cluster. For example, total cholesterol and LDL may be moderately high, and your HDL a little low. But, if your hs-CRP is elevated, taken together the high hs-CRP magnifies the risk for a heart attack or stroke. (Ridker, 2005)
Variations of hs-CRP can occur during the day. Highest levels take place in the morning and lowest levels at midday. (Koc, Karaarslan, Abali, & Batur, 2010)
Is There an Optimal Cut-Off Point for hs-CRP?
Decades of research went into the study of CRP. It’s now widely accepted as a predictor of risk for cardiovascular disease and metabolic syndrome, itself a risk factor for heart disease.
Most of the studies were compiled in North America and Western Europe. Both are areas of the world with high incidences of obesity, cardiovascular disease, metabolic syndrome, and diabetes. CRP is used to evaluate all of these conditions.
But what about areas of the world that have lower incidences of cardiovascular disease, like Japan? What about American patients who live a healthy lifestyle and eat a plant-based diet, or live an Asian style or consume a Mediterranean diet?
A Japanese study found that a better cut-off point for this patient group may be 0.65 mg/L instead of 1.00 mg/L. (Oda, E., & Kawai, R.,2009)
What Is an Ideal hs-CRP Level?
For the average population, the low-risk range of less than 1.0 is acceptable. But, I prefer a tighter range. For my patients, who are mostly proactive about their health and already eat a predominantly plant-based diet, I agree with the Japanese study: an optimal cut-off point would be less than 0.65. (Oda et al., 2006)
In another study of patients with metabolic syndrome, the optimal cut-off point may be 0.45. (Oda & Kawai, 2009) This study suggests that the lower the hs-CRP value, the better. Optimally, close to zero is best.
Your hs-CRP can be high without any symptoms. That’s why it is important to get tested. A morning fasting test is best. If your hs-CRP level is high, make lifestyle and dietary changes and retest in six months.
Get Tested And Evaluate Your Results Wisely
Annual blood testing is single the most important choice you can make to prevent serious illness. Learning optimal levels for key blood test markers is the best tool to improve your health and live longer. Interpreting your tests wisely requires understanding what the results mean. Remember, disease factors add up. Evaluate each marker carefully.
To learn more about Dr Williams please visit here
References:
Devaraj, S., Valleggi, S., Siegel, D., & Jialal, I. (2010). Role of C-reactive protein in contributing to increased cardiovascular risk in metabolic syndrome. Current Atherosclerosis Reports, 12(2), 110–118. http://doi.org/10.1007/s11883-010-0098-3
Koc, M., Karaarslan, O., Abali, G., & Batur, M. K. (2010). Variation in high-sensitivity C-reactive protein levels over 24 hours in patients with stable coronary artery disease. Texas Heart Institute Journal, 37(1), 42–8. Retrieved from http://www.ncbi.nlm.nih.gov/pubmed/20200626%5Cnhttp://www.pubmedcentral.nih.gov/articlerender.fcgi?artid=PMC2829811%5Cnevernote:///view/469804855/s16/d0602bb4-c62a-4a32-a3f3-5760008b04a3/d0602bb4-c62a-4a32-a3f3-5760008b04a3/
Lee, J., Yoon, K., Ryu, S., Chang, Y., Kim, H.-R., & Nakano, T. (2017). High-normal levels of hs-CRP predict the development of non-alcoholic fatty liver in healthy men. PLOS ONE, 12(2), e0172666. http://doi.org/10.1371/journal.pone.0172666
Oda, E., & Kawai, R. (2009). Tentative cut point of high-sensitivity C-reactive protein for a component of metabolic syndrome in Japanese. Circ J, 73(April), 755–9. Retrieved from http://www.ncbi.nlm.nih.gov/pubmed/19225207
Oda, E., Oohara, K., Abe, A., Veeraveedu, P. T., Watanabe, K., Kato, K., & Aizawa, Y. (2006). The optimal cut-off point of C-reactive protein as an optional component of metabolic syndrome in Japan. Circulation Journal : Official Journal of the Japanese Circulation Society, 70(4), 384–388. http://doi.org/10.1253/circj.70.384
Ridker, P. M. (2005). C-reactive protein, inflammation, and cardiovascular disease: Clinical Update. Current Issues in Cardiology, 32(3), 384–386.
Salazar, J., Martínez, M. S., Chávez-Castillo, M., Núñez, V., Añez, R., Torres, Y., … Bermúdez, V. (2014). C-Reactive Protein: An In-Depth Look into Structure, Function, and Regulation. International Scholarly Research Notices, 2014, 1–11. http://doi.org/10.1155/2014/653045